After seeing the July RSS anomaly that showed a warm July, I was perturbed that – once again – I was languishing in cool weather in Wisconsin while someplace else apparently “suffered” from warmer temperatures. Looking at the territorial data, one of the culprits for that nasty warm weather was the extreme south. It was rightly pointed out to me a while back that I must be careful in presenting the RSS data as “Antarctic,” since it only goes to the latitudinal line of -70 degrees. So, please know that when I reference the Antarctic region here, it simply means the -60 to -70 region, which is as far dwon as RSS goes.
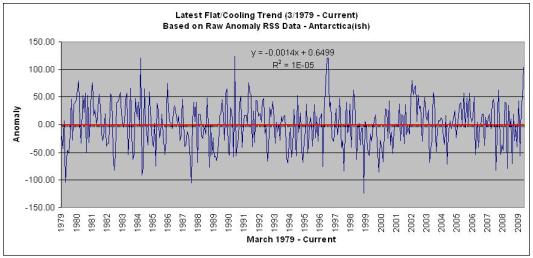
The July anomaly in this region was 1.0490 (a full degree Celsius and then some), which was a pretty warm one. It is the 5th highest anomaly in the 367 data points and is the 2nd warmest July in the 31 data points. It is nearly 7 tenths of a degree warmer than a year ago and the anomaly if 0.56 units higher than last month.
Keep in mind that it’s winter down there right now. I point that out because I guess I’m just not sure how much of a difference a degree makes in July with regard to melting ice. I know that when it’s winter here, -19 doesn’t seem to do much more than -20. But what do I know? I’m just an actuary. And a Packer fan. Are you watching these guys? The offense is looking phenomenal! Preseason or not, I’m getting pumped for the season to start.
But I digress.
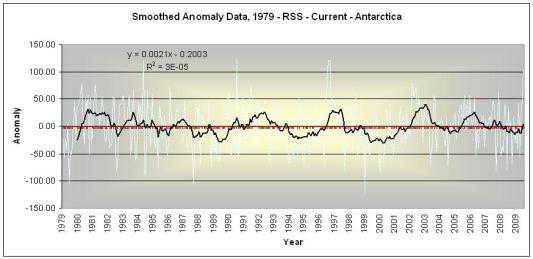
Anyway, the last 13 12-month average anomalies had been negative, but thanks to the most recent one, the current 12-month average is at 0.45 (0.0045 in degrees Celsius). That’s not even a hundredth of a degree, so it’s essentially flat.
There’s no real streak of warming or cooling to consider. This is the second straight year-over-year increase, after 2 decreases. In fact, there really have been no real streaks to speak of for years. You have to go back to 2003 just to find the last time there was 6 months of consecutive anything. And that one was a consecutive cooling stretch.
Trends
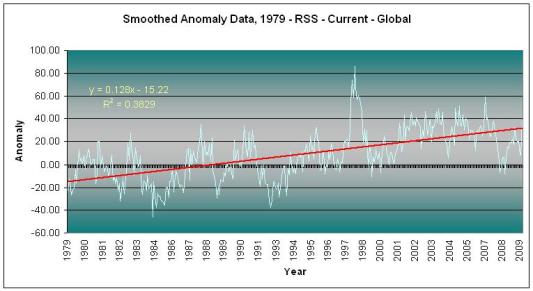
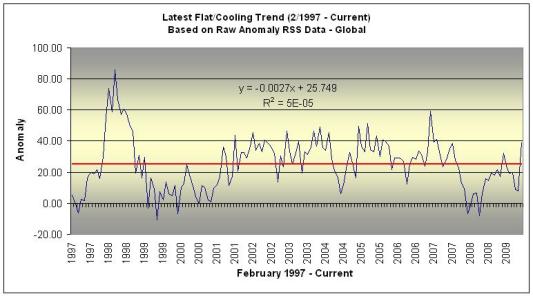
Despite the current large anomaly, it is evident that there is no particular long-term trend. There are fluctuations both positive and negative about an almost perfectly flat zero line. Also, there doesn’t seem to be any particular indication that things are fluctuating wildly about any more than they have in the past. In fact, the last 10 years saw no anomalies above an absolute value of 1.000 until this one, which is the largest gap in the data. We often hear about how climate change is producing more extremes, but we don’t see that in this data.
Read the rest of this entry »


