Digital Diatribes

A presentation of data on climate and other stuff

Archive for the ‘Ice Area’ Category

Two Posts in One: Personal – Life Update, and May Outlook on Arctic Ice Extent

Posted by The Diatribe Guy on May 4, 2010

Well, another month has gone by since I’ve taken a look at the Arctic Ice Extent. Actually, another month has gone by since taking a look at just about anything.

Why the low post output, you may ask? And what’s up with the Forex posts?

1) First, the Forex posts are just a little fun experiment with trading gold, and it involves numbers, and it’s really pretty easy to summarize my trading every couple weeks and throw up a post. I link to this from an actual trading site, so I kill two birds with one stone. I figured some of you would find it a little interesting and the rest of you would ignore it.

2) Gotta admit, life’s toils are taking a toll on free time and free time pursuits. My major issue is really the fact that I have numerous interests and only so much free time. As much as I love science and math and trends and climate/weather and stuff, I also try to find time for family (the big one), music (not as big as I’d like), writing (non-blog type of stuff), sports/exercise, I like to read other non-newsy stuff occasionally (both fiction and theological) and then there’s always that pesky work that needs to get done. You see, if I were a one-trick pony, I’d put a lot of effort in here and maintain consistency. Quite honestly, I go in spurts. In a way I get bored, but it’s more than that. I get frustrated. I get tired of the same arguments. I get tired of looking at data and seeing the obvious, only to be told otherwise by the experts, and then in three years when my childlike predictions are spot on, I’m told that I still don’t know what I’m talking about because I’m not a climatologist. Oh, it’s fun for a while, but then I hit a wall and just really want to think about something else and spend my time elsewhere.

3) I am in charge of a department of 2.5 people. (Hours-wise… it’s really a full person sitting there for half a day) I had a baby. The other full-timer had a baby. Then the half-timer had a week’s training. Then this volcano kicked our butts (travel insurance, you know). Between work and family, I have been swamped.

OK, enough of that… let’s look at some ice extent.

Arcitic Ice Extent as of May 4, 2010

Arcitic Ice Extent as of May 4, 2010

The latest ice extent reading says that 2010 is now slightly below 2009. This is a new development, as the 2010 ice extent over the last couple weeks of April was at its highest level on the chart, which is the plot of satellite readings since 2003 (2002 started later in the year).

I started following the ice extent after the 2007 minimum, followed by the winter rebound. I argued at the time that due to all the physics and stuff regarding the thermal retention of water and yada yada that we couldn’t expect the minimum to just go from an all-time low to normal in the course of a year. I predicted that 2008 would exceed 2007 and 2009 would exceed 2008, and that both years would still be below normal. Earlier this year, I predicted that 2010 would be near normal. My predictions weren’t based on fancy models, climatology, or anything else. It was, I thought, common sense.

Well, to date I’ve been right. It’s either “blind squirrel finds a nut” syndrome or it means that common sense has a place in the world even when fancy models are saying otherwise.

But let’s move on to the current situation. In one respect, the ice extent measures to date for 2010 have been somewhat remarkable. Global temps are up over the last few months, driven by El Nino and AMO, and even a rebound in the PDO. And yet, ice extent has been at a higher level than the past few years. So, now we hear about “volume,” which nobody seemed to care about until ice extent and area charts seemed to lack cooperation in the great global warming debate. We have been led to believe in the past that the global temperature rise is the reason for lower ice area. But it’s clear that there’s more to it than that. Jeff at The Air Vent has fairly convincingly promulgated the idea that it’s largely about the wind, baby.

So, here we are. What do I expect? Well, I’m sticking to my thought that the 2010 minimum comes in above 2009, and will be in the more cluttered area of the chart. I ran a simple mathematical model to predict this year’s minimum based on the ratio of icea area per day in relation to the year’s minimum. Running that model for 2003 – 2008 from January 1 to May 3, the results are anywhere from 5.0 million square km to 5.3 million square km. Last year’s minimum was 5.25 million square km. I personally think we’ll see things come in a little bit higher than that, even. 5.3 million would be about the level of 2005, but in order to get back to 2004/06 levels, the minimum would need to be about 5.8 million square km. I’m thinking we’ll land somewhere in between that, say at 5.5 – 5.6 million. Just a guess.

Posted in Arctic, Ice Area, Life | Tagged: , | 4 Comments »

It’s Melting! It’s a Travesty! It’s Warm Up There! It’s… Uh… never mind. move along… nothing to see here…

Posted by The Diatribe Guy on March 30, 2010

So I just had to post the following picture from IJIS:

The North Pole is Not Cooperating

OK, so this is a linked image that will change. I am posting this on March 30, so take a look at the red line just before the April tick mark.

What do you see? Here, let me give you some options. Feel free to select more than one:

a) Joe, I see a tragic decline in Sea Ice, which is perfectly explained by the GISS super-duper increased temperature anomalies at the North Pole
b) Joe, I see Armageddon. The trend I see keeps me awake at night, as I picture a worldwide flood from all the melting ice.
c) Joe, I’m confused. Hansen and company tell me it’s really hot up there, but that red squiggly line is increasing. The graph is clearly wrong.
d) Joe, you and your denier friends are all the same. I will not address this chart because you’re obviously a denier hack who loved Bush and is more concerned with killing baby seals than getting to the truth about climate change.
e) Huh. I see the highest level of sea ice for this time of year on the chart. Looks like it’s increasing. Weird.
f) Joe, I’m scared. Does this mean we’re all going to be frozen in blocks of ice? If I do what climatologists do and extrapolate the trend of the last few days forward, it looks like the whole world will be covered in ice, I estimate, in about 13 weeks.

OK, I’m having fun here, but seriously… can the rebounding ice at the North Pole get a little mainstream media love? Isn’t this great news for Polar Bears and stuff?

We’ve done it, people! We’ve solved the climate crisis! Give yourselves a round of applause.

(Yes, I know the danger of a post like this is that the whole thing suddenly melts and it makes me look like a fool. I’ll take my chances.)

Posted in Arctic, Ice Area | Tagged: , , , | 4 Comments »

Arctic Temperatures Since the mid-90s – Climate Sanity

Posted by The Diatribe Guy on September 15, 2009

I ran across a recent post on Climate Sanity that I thought was an interesting follow-up to my Arctic update using the RSS anomaly data.

To summarize my post: one can plainly see that since 2001, the RSS anomalies have declined on an overall basis, with the rate of decline being steeper the shorter the time frame. Beyond that, the linear best-fit on all longer periods is increasing. My analysis was done on the RSS data from latitude 70-85, which should cover things pretty well (though there is that pesky 5 degrees that isn’t covered). It is based on a best-fit of the anomalies on a month-by-month basis through July 2009. The satellite data goes back to 1979.

Our friends at Climate Sanity have looked at the DMI data by going through a process of extracting data from graphs.

The overall conclusions seem pretty similar if you read the post (linked above in the first line – or click on the link under my blogroll. I have not asked permission to duplicate the post here, so I’ll provide reference links instead.) Fitting linear trends yields overall warming on longer periods, but the highest slope occurs from the mid-90s to current. Read the rest of this entry »

Posted in Arctic, Ice Area, Science, Temperature Analysis | Tagged: , , , | 5 Comments »

Update on Arctic Temperature – RSS July Anomaly

Posted by The Diatribe Guy on September 4, 2009

Since the Arctic always seems to be the “hot” discussion point in the discussion of climate change and global warming (does it seem unusual to anyone else that a discussion of a supposed global phenomenon almost always seems to come back to a discussion of melting ice in the Arctic?) I thought I’d provide an update on the Arctic charts. Since I’ve already mentioned the ice, let’s see what that’s up to (from the IJIS data – link on the right):

amsre_sea_ice_extent_09_01

IJIS Arctic Ice Extent

I posted this on a comment on The Air Vent but I’ll repeat it here:

Anyway, in looking at the IJIS chart (not only above, but the current one) it seems pretty much as expected. I’m going to reference a post I made in early June: https://digitaldiatribes.wordpress.com/2009/06/04/quick-hit-post-on-the-arctic-ice/

Where I said this: “As of today, June 4, it is below the 2003 level, but holding in second position. As an aside, I wouldn’t at all be surprised to see this tail off quite a bit and dip below most of the years again. Looking at 2008 this happened, but not to the extent that it melted in 2007. It can reasonably be expected that the ice just won’t jump by leaps and bounds at maximum melt, while still in an increasing mode. So, 2009 may well dip below normal before it’s said and done, but my own guess is that it will still end up higher than 2008, thus continuing the upward trend.”

Unless we get some serious meltage going on soon, it looks like I’ll be right. Am I proud? Not really. It’s pretty much common sense along with a rudimentary understanding of Physics, energy requirements, and heat transfer. One doesn’t need to be an expert to look at the temperature trends along with 2007 ice levels and develop the idea that there will be a likely slow positive accumulation of ice over time.

So, what do I mean by these temperature trends? I mean, it’s warming in the Arctic, right?

Let’s take a look. All data is directly from the RSS data link that is located on the right, under resources. I suppose if you believe it to be bogus, you can take it up with them… Read the rest of this entry »

Posted in Arctic, Climate Change, Earth, Global Warming, Ice Area, Science, Temperature Analysis | 8 Comments »

Quick hit post on the Arctic Ice

Posted by The Diatribe Guy on June 4, 2009

Very quick post here: Click the link to the right (IJIS) to check out the latest Arctic ice extent. As of today, June 4, it is below the 2003 level, but holding in second position. As an aside, I wouldn’t at all be surprised to see this tail off quite a bit and dip below most of the years again. Looking at 2008 this happened, but not to the extent that it melted in 2007. It can reasonably be expected that the ice just won’t jump by leaps and bounds at maximum melt, while still in an increasing mode. So, 2009 may well dip below normal before it’s said and done, but my own guess is that it will still end up higher than 2008, thus continuing the upward trend.

What I wanted to point out, however, is this little jump that occurs on June 1 of each year. Why does that happen?

I was curious, and looked into it a bit, and what I learned was that there is an adjustment that occurs at that point. During the winter, satellite readings of open water accurately decipher it as open water. During the spring melt, however, pools of water can start to form on the ice, and satellites may start to read these pools as open water. This assumption is made in the satellites prior to June 1. As of June 1, an adjustment is made to recognize this pooling of water on the ice, and so the ice extent increases a bit. This happens every year, so we see a little jump on June 1 each year.

What I couldn’t find was the date for the counter adjustment in the late fall/early winter, which I’m assuming has to occur at some point in order for there to be a consistent spring adjustment made. Nor does the chart seem to indicate what that date may be. My guess is it’s December 1 (6 months offset).

I’m uncertain as to why they don’t just always make that same adjustment. If it’s exceptionally warm for a bit, and there is pooling earlier than normal, a pre-June reading will understate ice extent. It seems to me that if the criteria for determining whether or not some water is open ocean or a swimming pool are good, the season shouldn’t matter.

But what do I know? Anyway, just wanted to share that little tidbit.

Posted in Arctic, Ice Area | Tagged: | Leave a Comment »

What Giveth in the Ice Debate? (Southern Hemisphere)

Posted by The Diatribe Guy on May 27, 2009

Maybe some of you intelligencia can shed some light on this for me… This post is nothing earth-shattering, not data driven, and is not particularly original. But I’ve been musing. And what I’ve been musing is that, whatever your personaly belief is about Anthropogenic Global Warming, Environmentalism, Stewardship of our Planet, or whatever else, there is also the need for honest assessment of the facts. Sometimes these facts are comfortable to our preconceived notions, and sometimes they are not.

Back to my analogy… the concern on my end is continually throwing stupid policy after stupid policy (tax and regulation, banning light bulbs, carbon trading, banning lamb meat from UK restaurants, and so on) to solve a non-existent problem. With each step we take, it centralizes more authority and control into the hands of a few, it creates inefficiency, and reduces freedoms, rights, and choices. Seriously… 20 years ago, did we ever imagine that we’d live in a country where the sale of incandescent light bulbs would be friggin’ illegal?

Suppose I think that a certain stock that has dropped will rebound. There are conflicting reports as to its outlook, but I’ve decided to ignore the negative ones. I invest in it. It drops again. I still believe in it, and despite the poor earnings and financial results, I continue to think it’s a winner, so I pour more money in. It drops some more. Damn it, it will come back. I know it will. So I pour everything I have into it. When the company declares bankruptcy, only then will I realize that believing in something in the face of contrary facts, and acting on that belief can have dire consequences.

So, this could be applied to a number of things in the climate debate. Some things seem less clear than others. For example, we have a 12-year flat trend line in global temperatures, using RSS data, but within that period, the last 10 years is actually upward sloped, as are the longer-term periods. Reasonable people on both sides can offer facts that support their opinions, while the honest person will acknowledge that the final answer is not clear. Is the current period a true flattening? The start of a reversal? Or simply a lull in the path of more warming to come?

But then there’s the Southern Hemisphere Ice. And it’s simply mind-boggling to me that the data is basically ignored. Not only is it ignored, but when one piece of the Antarctic shelf is cleaving or melting, it makes the news. Absent in the report is the overall picture. I won’t go into all that, especially since anything I could do would pale in comparison to the work that Jeff has done at the Air Vent (link to the right). Here’s one such example, but he has a plethora of work that he has done reconstructing and analyzing the reports that supposedly somehow showed Antarctic warming, despite increasing ice and decreasing temperatures over the last 30 years.

There are lies, damn lies, and statistics…

But all one has to do is look at the charts. Click on the chart to get a bigger version. Here they are (all charts come from http://arctic.atmos.uiuc.edu and are linked on the right of the page):

SH Ice Anomaly

This chart shows the anomalies. For those of you in Palm Beach, a positive anomaly means more ice than typical (defined as the average from 1979-2000).

I asked my 3rd grader if this chart seems to be going up from left to right or down. He said up. My 3rd grader seems more astute in his observation skills than some scientists who don’t like that answer.

SH Ice Area Last Year

This chart shows the ice area over the last year. Again, there is an anomaly line below. That red part above the flat black line = higher.

I suppose you can quibble about the fact that, at this point this year, the ice level isn’t as high as it was last year.
Read the rest of this entry »

Posted in Antarctica, Arctic, Climate Change, Earth, Global Warming, Ice Area | Tagged: , , , | 2 Comments »

A Funny Thing Happened on the Way to an Ice-Free North Pole

Posted by The Diatribe Guy on April 23, 2009

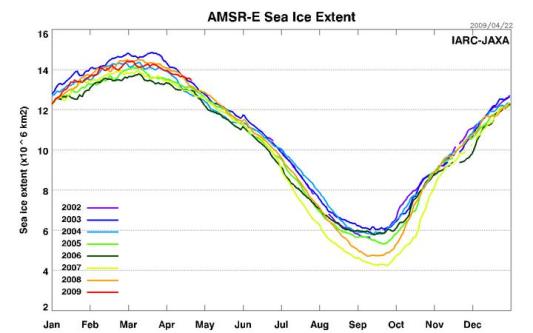
It would appear that the North Pole is not cooperating with the kayakers who want to go straight through from Canada to Russia.  This, according to IJIS:

IJIS Arctic Sea Ice Extent

Despite the hot air emanating from politicians who continue to tell us the ice cap is melting, the current level of ice is at a peak for this time of year based on recent history.

Data only goes back a few years, so I’m not claiming any records. But it’s worth pointing out in the context of the message of the day that the ice cap is melting.

Why can’t we just be honest about things?   A couple years ago, the ice extent most certainly hit a trough.  That was an accurate assessment.  And boy, did we hear about it.   Currently, ice extent is at a peak.   Crickets. I’m finding a lot of lack of integrity enters when it comes to this issue. (That cuts both ways at times. I have my own opinions about things, but let’s confront the data for what it is and not brush it under a rug.)

Theory is great and all, as are people who become experts.  But quite honestly, I trust the data and some simple analysis more than I trust all these complex uber-theoretical models.  They may have some assessment value, but their predictive value has time and time again been worthless.

Posted in Arctic, Earth, Global Warming, Ice Area | Tagged: , , | 5 Comments »

Fastest Arctic Ice Growth…

Posted by The Diatribe Guy on February 3, 2009

Jeff at The Air Vent has done some work and noticed that something interesting has happened in the Arctic. You know how we heard all about that “Fastest ice melt ever” that sent the AGW proponents into a panic a while back? Well, interestingly (but not surprisingly), they seem to have neglected to inform us that the reverse has occurred in recent months.

Arctic Ice

Check out his post, Arctic Sea Ice Increases at Record Rate.

Posted in Arctic, Ice Area | Tagged: , , | Leave a Comment »