Temperature Trends for the last 180 months – HadCrut
Posted by The Diatribe Guy on May 17, 2012
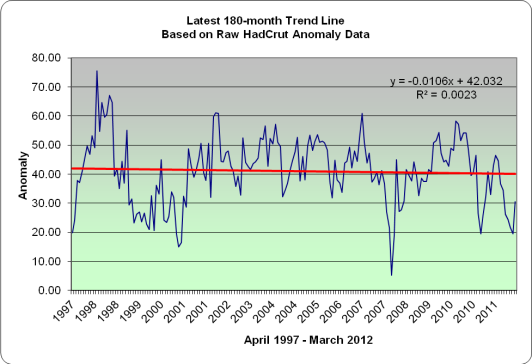
Here are the latest charts for the HadCrut Global Temperature Anomalies, for the 15 year period ending March 2012.
The Data
What is presented here is the trend over the last 180 months, the slope of which has been in very consistent decline over the last five years. The current slope itself is -.0106, and it is the second month in which the trend line is negative. The current slope is the lowest value for a 15 year trend line fitted since February 1977 (back when people were concerned about another ice age).
Chart below:
The next chart is simply a point of comparison. The highest slope value in recent years occurred with the 15-year period ending February 2007.
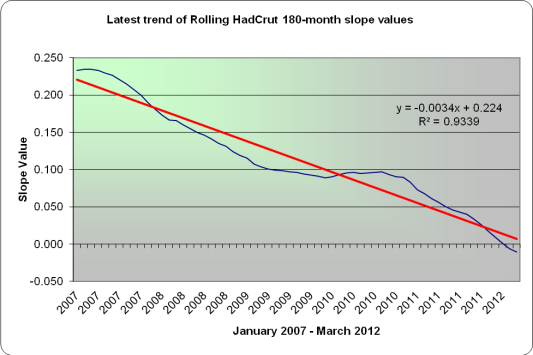
Finally, I show what has transpired with the slopes over the last number of years with the 15 year trend line. There has been a consistent decline in the slopes of the best-fitted lines. The decline itself is a very close linear fit. There is little indication that this decline will halt in the near term. If I plug the latest 12-month average anomalies into each of the next 6 months, we see this trend line dipping below the -0.03 mark.


Friday Funny – Do Ha Ha | Watts Up With That? said
[…] The graphed data was taken from here […]